Section 2: Data Preparation and Cleaning in Excel
Learning Objectives
By the end of this section, you will:
- Choose appropriate file formats (CSV vs XLSX) and import data correctly to preserve integrity
- Apply systematic data cleaning techniques using Excel’s essential functions (TRIM, CLEAN, SUBSTITUTE)
- Detect and handle outliers using statistical methods (Z-score and IQR) with business context
- Follow optimal cleaning sequences to prevent cascade errors and data corruption
- Implement quality assurance processes and document all data transformations
Starting With Files: The Foundation of Analysis
Before opening Excel, you face a fundamental choice: what file format contains your data? The two formats dominating business analytics are CSV (Comma-Separated Values) and XLSX (Excel Workbook). This distinction matters more than most analysts realize.
CSV files store data as plain text, with commas separating values and line breaks separating rows. Their simplicity makes them universal - any system can read them. But this simplicity comes with limitations: no formatting, no formulas, no multiple sheets, and dates often convert to text strings. An XLSX file, by contrast, preserves everything Excel offers: formulas, formatting, data types, and multiple worksheets. The trade-off? Only Excel and compatible software can fully interpret them.
Why does this matter for your analysis? Opening a CSV in Excel triggers automatic conversions that can corrupt your data. Leading zeros disappear from zip codes. Long ID numbers transform into scientific notation. Dates shift formats based on regional settings. These silent transformations happen before you even see the data, creating errors that persist throughout your analysis.
| Feature | CSV Files | XLSX Files |
|---|---|---|
| Format | Plain text, comma-separated | Binary format with metadata |
| Compatibility | Universal, any system can read | Excel and compatible software only |
| Data Types | All data stored as text | Preserves numbers, dates, formulas |
| Formatting | No formatting preserved | Maintains colors, fonts, borders |
| Multiple Sheets | Single sheet only | Multiple worksheets supported |
| File Size | Smaller, text-based | Larger, includes formatting data |
| Data Integrity | Prone to conversion errors | Preserves original data types |
| Use Case | Data exchange, simple storage | Complex workbooks, analysis |
When importing CSV files, use Excel’s “Get Data” feature rather than double-clicking the file. This approach lets you specify data types for each column, preserving the original integrity of your data. For XLSX files, check the source system that generated them - many business applications export “Excel” files that actually contain hidden formatting issues or merged cells that will break your analysis.
The Analytical Process: From Chaos to Clarity
Raw data arrives as a collection of possibilities, not answers. The path from messy spreadsheet to actionable insight follows a systematic process that separates professional analysts from those who just make charts. This process begins before you clean a single cell.
Start by understanding what decisions your analysis will support. A vague request like “analyze our customer data” becomes specific when you ask the right questions. Each decision requires different data preparation strategies.
Key Questions to Ask: – What decision depends on this analysis? – Are we choosing which products to discontinue? – Identifying which customers to target for retention?
Next, create your data review checklist:
This initial review reveals the scope of cleaning required and prevents surprises later. A marketing analyst might discover their social media engagement data includes bot traffic, which requires different cleaning approaches than human interaction data. A hospital administrator might find test patient records mixed with real admissions, each of which requires different handling.
Write your hypothesis before touching the data. “Customer churn increases after price changes” gives you a clear target. This hypothesis drives which columns matter, what cleaning takes priority, and when you can stop perfecting and start analyzing. Without this focus, data cleaning becomes an endless task with no clear completion point.
Understanding Data Types and Quality Dimensions
Excel recognizes four primary data types: text, numbers, dates, and logical values (TRUE/FALSE). But business data rarely arrives in these neat categories. Phone numbers stored as text, dates formatted as numbers, currency with embedded symbols - these mismatches create calculation errors and break sorting.
| Data Type | Examples |
|---|---|
| Text | “John Smith”, “ABC-123” |
| Numbers | 150, 3.14159 |
| Dates | 12/25/2023, January 1, 2024 |
| Logical Values | TRUE, FALSE |
The data type determines what operations Excel allows. Text concatenates; numbers calculate. Dates can subtract to find durations; text dates cannot. This distinction becomes critical when you discover that half your dates imported as text because they used forward slashes while the other half used hyphens.
Beyond types, data quality manifests in six measurable dimensions:
          ┌─────────────────────────────┐
          │   Data Quality Assessment   │
          └─────────────┬───────────────┘
                        │
        ┌───────────────┼───────────────┐
        │               │               │
    Accuracy      Completeness    Consistency
        │               │               │
   Correct         All Required    Same Format
   Values          Fields Present   Everywhere
        │               │               │
        └───────────────┼───────────────┘
                        │
        ┌───────────────┼───────────────┐
        │               │               │
    Validity      Timeliness      Uniqueness
        │               │               │
   Follows          Current        No Duplicates
   Business         Enough for     in Key Fields
   Rules            Decision
Accuracy means your data reflects reality. If your system shows 150 units in inventory but the warehouse contains 147, you lack accuracy. Completeness indicates whether all necessary fields contain values - not every field, just the ones required for your analysis. Consistency guarantees the same information appears identically across your dataset.
The Cleaning Toolkit: Excel Functions That Matter
Data cleaning in Excel relies on a small set of workhorse functions that handle 90% of problems. When you understand how to apply each function, you transform cleaning from random button-clicking to systematic problem-solving.
TRIM removes extra spaces that invisible corrupt your data. These spaces prevent matches, break sorts, and hide in imported data. The function strips leading spaces, trailing spaces, and reduces internal spaces to single spaces: =TRIM(A2) turns ” John Smith ” into “John Smith”.
PROPER, UPPER, and LOWER standardize text case. Customer names arriving in various formats become consistent. =PROPER(B2) converts “jOHN SMITH” to “John Smith”, fixing the random capitalization that plagues manual data entry.
CLEAN eliminates non-printing characters that arrive from web scraping or database exports. These invisible characters break formulas and prevent matching. =CLEAN(C2) removes character codes 0-31, the hidden gremlins in your data.
SUBSTITUTE replaces specific text within cells, useful for standardizing variations. When your data contains both “Inc.” and “Incorporated”, SUBSTITUTE creates consistency: =SUBSTITUTE(D2,"Inc.","Incorporated") creates uniform company names.
Statistical Outlier Detection: When Data Tells a Story
Example: Retail sales outlier analysis. Consider a retail analyst reviewing monthly sales data across 200 stores. Most stores show sales between $50,000 and $150,000, but three stores report $2.3 million, $47,000, and $1.8 million respectively. Are these errors to clean, or business opportunities to investigate? The answer depends on understanding both the statistical patterns and the business context.
Outliers represent data points that deviate significantly from the expected pattern. In business analytics, outliers often signal either data errors or genuine business insights. The challenge lies in distinguishing between the two. Statistical methods provide objective criteria for identification, but business knowledge determines the appropriate response.
The Z-score method identifies outliers by measuring how many standard deviations a value lies from the mean. The formula Z = (X - μ) / σ calculates this distance, where X is the data point, μ is the mean, and σ is the standard deviation. Values with |Z| > 3 typically qualify as outliers, meaning they fall more than three standard deviations from the mean.
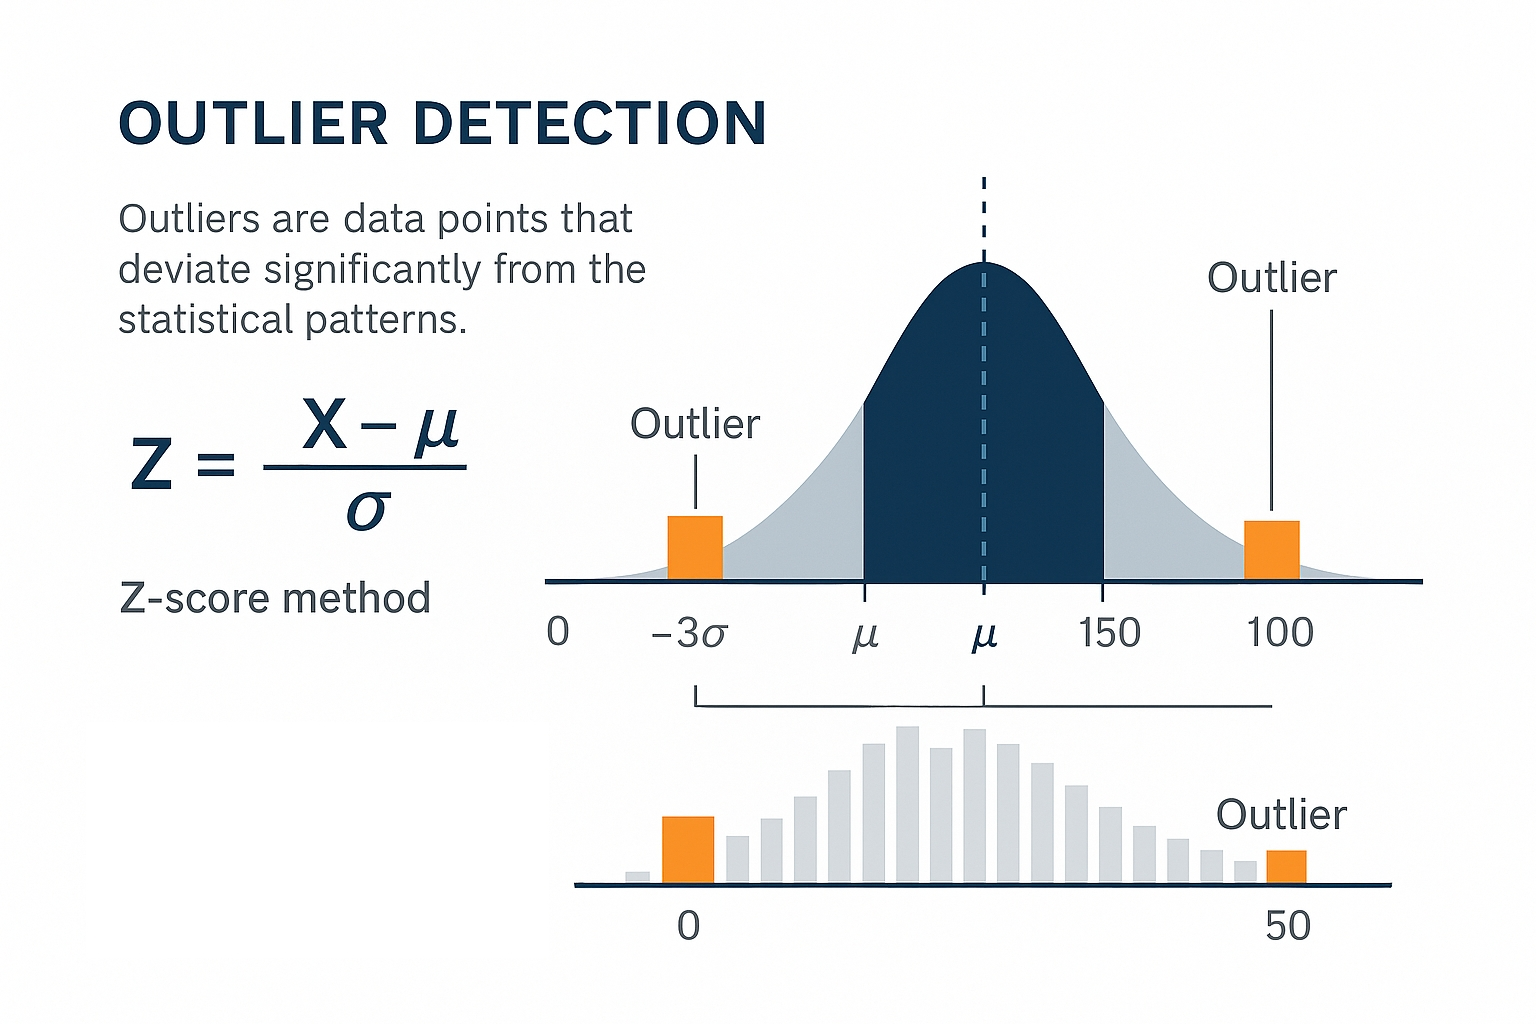
Example: Z-score outlier visualization. The image above shows how outliers are identified using the Z-score method, with both a normal distribution curve and histogram representation. Data points beyond ±3σ (standard deviations) from the mean are considered outliers.
Example: Excel Z-score calculation. Excel implementation:
=ABS((A2-AVERAGE($A$2:$A$1000))/STDEV($A$2:$A$1000))calculates the Z-score for each value. Filtering for scores above 3 reveals potential outliers.
The Interquartile Range (IQR) method works better with skewed data distributions common in business. IQR represents the spread of the middle 50% of data, calculated as Q3 - Q1 (third quartile minus first quartile). Outliers fall outside the range [Q1 - 1.5×IQR, Q3 + 1.5×IQR].
Example: Excel IQR outlier calculation. Excel implementation:
=QUARTILE($A$2:$A$1000,1)finds Q1,=QUARTILE($A$2:$A$1000,3)finds Q3. The outlier threshold becomes Q1 - 1.5(Q3-Q1) for lower bound and Q3 + 1.5(Q3-Q1) for upper bound.
Visual inspection through box plots reveals outliers immediately. Excel’s box plot chart type shows the median, quartiles, and outliers as individual points beyond the whiskers. This visual approach complements statistical methods by revealing patterns that formulas might miss.
Example: Business context for outlier interpretation. The retail analyst discovers that the $2.3 million store opened a new flagship location, the $47,000 store closed for renovation, and the $1.8 million store had a major promotional event. Each outlier represents a legitimate business event requiring different analytical treatment.
| Outlier Type | Statistical Signal | Business Action | Analysis Impact |
|---|---|---|---|
| Data Entry Error | Extreme Z-score, impossible values | Remove or correct | Clean dataset |
| Business Event | High Z-score, explainable | Flag for separate analysis | Include with context |
| New Pattern | Moderate Z-score, recurring | Investigate further | May indicate trend |
This framework transforms outlier detection from a technical exercise into a business decision process. The statistical method identifies candidates, but business knowledge determines the appropriate response. What if that $2.3 million sale represents a new customer segment worth targeting? Removing it eliminates valuable business intelligence.
Pattern Recognition and Business Rules
Example: Real estate data pattern recognition and cleaning strategy. Consider a real estate agency tracking property listings across multiple agents. The data arrives with prices in various formats: some agents enter “$450,000”, others use “450K”, and one consistently writes “Four hundred fifty thousand.” The business rule is clear: all prices must be numeric for calculation. But the cleaning strategy depends on volume. With 50 listings, manual correction takes 10 minutes. With 5,000 listings, you need SUBSTITUTE formulas to convert “K” to “000” and VALUE to convert text to numbers. The pattern recognition here isn’t just about finding inconsistencies - it’s about choosing the most efficient correction method based on scale.
Patterns in dirty data reveal their origin. Systematic errors (every date from System A lacks years) require different handling than random errors (occasional typos). When you understand patterns, you can decide whether to clean through formulas, find-and-replace, or manual correction.
Business rules transform vague quality concepts into specific, measurable criteria. “Valid email address” becomes “contains exactly one @, has text before and after @, ends with known domain.” These rules guide your validation formulas and determine which records need investigation.
Building Your Cleaning Sequence
The sequence of cleaning operations matters. If you clean in the wrong order, you create new problems while you solve old ones. The optimal sequence minimizes rework and prevents cascade errors.
The optimal sequence follows four steps:
Handle structural issues: remove blank rows and columns, unmerge cells, convert pivot tables to values. Structural problems prevent other cleaning operations from working correctly.
Standardize formats: fix data types, standardize dates, clean text fields. Format standardization enables accurate duplicate detection and validation.
Validate and correct content: identify outliers using statistical methods, check business rules, fix known errors. Content validation works only after formats are consistent. Should you remove that $2.3 million sale or investigate why it happened? The statistical method identifies it as an outlier, but business knowledge determines the response.
Remove duplicates and document changes: Duplicate removal comes last because earlier cleaning might reveal that apparent duplicates were actually distinct records with formatting differences.
Example: Healthcare appointment data cleaning sequence. A healthcare clinic analyzing patient no-shows discovers their appointment data has multiple problems: dates in different formats, duplicate patient records, and missing provider names. Starting with duplicate removal would be catastrophic - patients with appointments on “01/03/2024” and “March 1, 2024” would appear as different people. First, they standardize all dates to MM/DD/YYYY format. Then they clean patient names (removing “Mr.”, “Mrs.”, standardizing spacing). Only then can they safely identify true duplicates. The missing provider names get filled using a VLOOKUP against the schedule master file. This sequence - format, clean, validate, deduplicate - prevents losing legitimate appointments while cleaning the data.
Quality Assurance and Documentation
Cleaning without verification is guessing. Every cleaning operation needs a quality check to confirm it worked as intended and didn’t introduce new errors. The simplest check: row counts before and after. If you started with 10,000 rows and ended with 8,500, you better know exactly why 1,500 disappeared.
Create summary statistics before and after cleaning. Average values, distinct counts, and date ranges reveal whether your cleaning preserved the data’s essential characteristics. A sudden shift in averages suggests your cleaning removed valid outliers or introduced calculation errors.
Document every transformation in a cleaning log. “Removed 847 rows where State = ‘XX’ (test data)” provides the context future analysts need. This documentation becomes critical when someone questions your results three months later.
Prevention Through Better Collection
The best data cleaning is the cleaning you never do. When you understand how dirty data originates, you can prevent future problems through better collection design.
Manual entry creates predictable errors: typos, inconsistent formats, and missing fields. Dropdown menus, validation rules, and required fields prevent these errors at the source. When you find yourself repeatedly cleaning the same issues, invest time in fixing the collection process.
System integrations introduce format mismatches and truncation. When sales data from your CRM meets financial data from your ERP, date formats clash and customer IDs don’t match. When you understand these integration points, you can build cleaning routines that run automatically.
The investment in prevention pays compound returns. Every hour spent improving data collection saves dozens of hours of cleaning across all future analyses. This shift from reactive cleaning to proactive quality represents the evolution from analyst to data strategist.
References
Kandel, S., Paepcke, A., Hellerstein, J., & Heer, J. (2011). Wrangler: Interactive visual specification of data transformation scripts. Proceedings of the SIGCHI Conference on Human Factors in Computing Systems, 3363-3372. https://dl.acm.org/doi/10.1145/1978942.1979444
Rahm, E., & Do, H. H. (2000). Data cleaning: Problems and current approaches. IEEE Data Engineering Bulletin, 23(4), 3-13. http://sites.computer.org/debull/A00DEC-CD.pdf
Wang, R. Y., & Strong, D. M. (1996). Beyond accuracy: What data quality means to data consumers. Journal of Management Information Systems, 12(4), 5-33. https://www.jstor.org/stable/40398176
Wickham, H. (2014). Tidy data. Journal of Statistical Software, 59(10), 1-23. https://www.jstatsoft.org/article/view/v059i10
Broman, K. W., & Woo, K. H. (2018). Data organization in spreadsheets. The American Statistician, 72(1), 2-10. https://doi.org/10.1080/00031305.2017.1375989
© 2025 Prof. Tim Frenzel. All rights reserved. | Version 1.0.6